Walmart WMT shares have struggled lately after consistently outshining others over the last few years. The stock outperformed peers like Target TGT, Home Depot HD, and even Amazon AMZN over the last five years, up more than +130% vs. +60.8% for Amazon, +2.1% for Home Depot, and -40.9% for Target. Walmart’s +130% gain over the last five years compares to a +77.7% gain for the S&P 500 index.
Walmart shares seem to have lost momentum this year even though the company continues to perform exceptionally well, as the year-to-date performance chart below for Walmart, Target, Amazon, Home Depot, and the S&P 500 index shows.

Image Source: Zacks Investment Research
Walmart shares were down following the last quarterly release on May 21st, even though it comfortably beat consensus EPS, revenues, and same-store sales estimates. The stock has failed to recoup those losses since then and remains -11.6% below its May 20th level.
It will be interesting to see whether the Thursday, August 20th quarterly release helps shift sentiment toward this retail leader, but the revisions trend has been modestly negative heading into this release. We will have seen results from Target and Home Depot ahead of Walmart’s release, with Home Depot reporting Tuesday morning and Target the day after (Wednesday, August 19th).
Walmart and other big-box retailers are undoubtedly facing a difficult operating environment, with elevated fuel costs not only adding to consumers’ financial burdens but also increasing retailers’ expenses. These macro overhangs prompted management to reiterate prior guidance in the May quarterly release, a move that became a key source of market concern. These headwinds likely played a role in Friday’s soft July Retail Sales reading.
It is important to keep in mind that Walmart shares command a premium valuation, trading currently at 37.6X forward 12-month EPS estimates, only modestly below the 10-year high valuation multiple of 45.4X in February 2026. This represents a significant expansion in the valuation premium relative to Target, as the chart below of the two stocks’ 10-year valuation history shows.

Image Source: Zacks Investment Research
It is reasonable to chalk up Walmart’s recent underperformance to its premium valuation, particularly in light of management’s conservative, if not altogether underwhelming, guidance back in May. Market participants expect stocks commanding premium valuation multiples to beat-and-raise when they report results.
Notwithstanding the negative effects of elevated fuel costs on consumer spending as well as the company’s freight costs, Walmart remains better positioned than many others in the space given its value orientation, greater indexing to groceries, and robust digital capabilities. Walmart has been consistently gaining market share among higher-income households in recent years, which has more than offset affordability-based demand softness from its lower-income consumers.
Walmart is expected to report $0.73 in EPS on $186.3 billion in revenues, representing year-over-year changes of +7.4% and +5.03%, respectively. Estimates have been under pressure, with the current 73-cent estimate down from 74 cents a month ago and 75 cents three months ago.
In terms of same-store sales, the expectation is for U.S. comps (ex fuel) of +3.57%, which will compare to a +4.1% gain in the preceding quarter (vs. expectations of +4.03%) and a +4.6% gain in the year-earlier period (vs. expectations of +3.98%).
The expectation for Target on the comps front is +2.29% growth, following the +5.6% gain in the preceding period (vs. expectations of 1.34%). Target’s impressive comp showing in the May 20th release followed four back-to-back quarters of negative comps.
A positive general merchandise read will also have positive read-throughs for Target.
With respect to the Retail sector 2026 Q2 earnings season scorecard, we now have results from 18 of the 31 retailers in the S&P 500 index. Regular readers know that Zacks has a dedicated stand-alone economic sector for the retail space, which is unlike the placement of the space in the Consumer Staples and Consumer Discretionary sectors in the Standard & Poor’s standard industry classification.
The Zacks Retail sector includes not only Walmart, Target, and other traditional retailers, but also online vendors like Amazon AMZN and restaurant players. The 18 Zacks Retail companies in the S&P 500 index that have already reported Q2 results are mostly in the ecommerce and restaurant industries, though we have several restaurant companies on deck to report this week as well.
Total Q2 earnings for these 18 retailers that have reported are up +12% from the same period last year on +15.4% higher revenues, with 77.8% beating EPS estimates and 55.6% beating revenue estimates.
The comparison charts below put the Q2 beats percentages for these retailers in a historical context.

Image Source: Zacks Investment Research
As you can see above, the revenue beats percentages for these online players and restaurant operators are tracking significantly below the historical averages for this group of companies, but EPS beats are far more numerous.
With respect to earnings and revenue growth rates at this stage, we like to show the group’s performance with and without Amazon, whose results are among those of the 18 companies that have already reported. As we know, Amazon’s Q2 earnings were up +12.6% on +19.6% higher revenues, as it beat both EPS and top- line expectations.
The two comparison charts below show the Q2 earnings and revenue growth relative to other recent periods, both with Amazon’s results (left side chart) and without Amazon’s numbers (right side chart)

Image Source: Zacks Investment Research
As you can see above, earnings for the group outside of Amazon are up +10.9% on a +10.0% top-line gain.
Q2 Earnings Season Scorecard
Through Friday, August 7th, we have seen quarterly results from 456 S&P 500 members, or 91.2% of the index’s total membership. Total earnings for these companies are up +41.5% from the same period last year on +14.7% revenue gains, with 83.6% of the companies beating EPS estimates and 76.5% of them beating revenue estimates.
The comparison charts below put the Q2 earnings and revenue growth rates for these index members in a historical context.
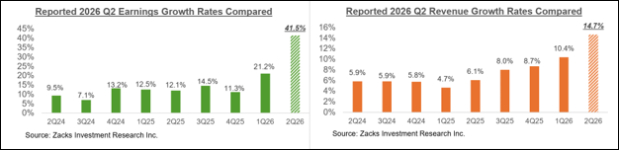
Image Source: Zacks Investment Research
The comparison charts below put the Q2 EPS and revenue beats percentages in a historical context.

Image Source: Zacks Investment Research
The unusually strong earnings growth rate of +41.5% and revenue growth of +14.7% are benefiting from Micron MU and Alphabet’s GOOGL blockbuster results.
The chart below shows the reported Q2 earnings growth pictures, with and without Alphabet and Micron.
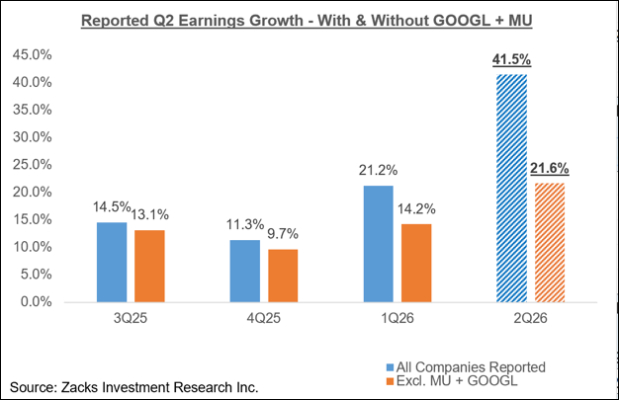
Image Source: Zacks Investment Research
The Q2 reporting cycle is in its final stretch now, with half of the 16 Zacks sectors having reported all of their results, including Energy, Finance, Construction, Basic Materials, Utilities, and others.
This week’s line-up includes more than 100 companies, 12 of which are S&P 500 members. Notable companies reporting this week, in addition to the aforementioned retailers, include Estée Lauder, Viking, Deere & Co., and others.
The Earnings Big Picture
The chart below gives you a big-picture view of the overall earnings picture. It highlights current Q2 expectations right alongside actual results from the past four quarters and forecasts for the next three (including 2026 Q2).

Image Source: Zacks Investment Research
As you can see here, total S&P 500 earnings for 2026 Q2 are expected to increase by +43.2% compared to the same period last year on +15.2% higher revenues.
Of the 16 Zacks sectors, 13 are expected to have positive earnings growth in Q2, with Energy (earnings growth of +142.8%), Tech (+95.1%), Basic Materials (+52.3%), and Finance (+22.3%) as the major growth drivers.
Q2 earnings growth drops to +18.5% from +43.2% once the Tech sector’s substantial contribution is excluded.
The +142.8% earnings growth for the Energy sector is meaningful, but aggregate earnings growth would still be up +38.9% on an ex-Energy basis. The sector simply no longer has the heft it once did.
The Tech sector has been a pillar of earnings growth over the last two years and is expected to continue playing that role in Q2 and beyond. The chart below shows current earnings and revenue growth expectations for the sector relative to what it actually reported in the preceding two periods and what is expected over the following three quarters.
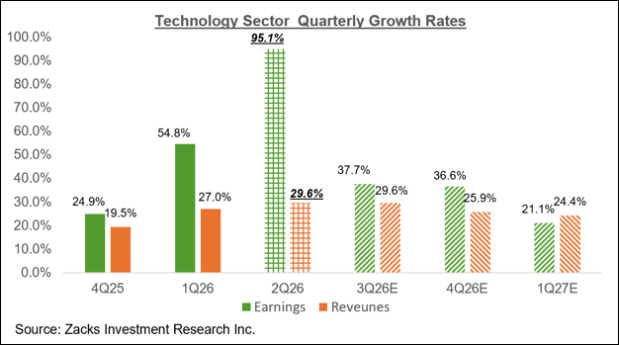
Image Source: Zacks Investment Research
The Tech sector is unlike the other 15 Zacks sectors, as it alone brings in 41.7% of all S&P 500 earnings and accounts for 46.3% of the index’s total market capitalization.
As noted earlier, Alphabet’s Q2 results included a huge boost from a non-operating side, specifically the unrealized gain it has been forced to book on its SpaceX stake following that company’s IPO. Alphabet isn’t alone in having an outsized impact on the sector’s growth pace, as Nvidia and Micron are also exerting an outsized influence.
Excluding the contribution from Alphabet, Micron, and Nvidia, Q2 earnings for the rest of the Zacks Tech sector would be up +33.6% (vs. +95.1% otherwise).
The chart below shows the Tech sector’s earnings growth picture, with and without these three companies.

Image Source: Zacks Investment Research
The chart below shows the aggregate growth picture for the S&P 500 index on a calendar year basis.
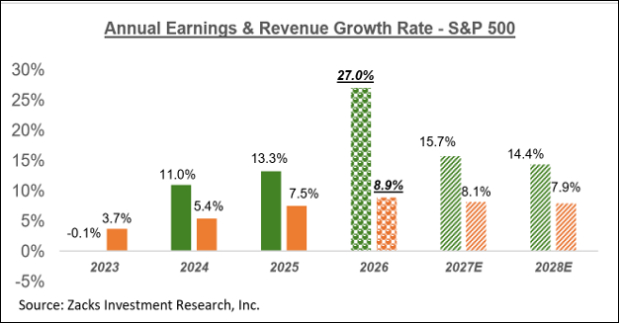
Image Source: Zacks Investment Research
As with Q2 expectations, the Tech sector has an outsized impact on the annual earnings picture as well. Total Tech sector earnings are expected to increase +50.8% from the same period last year on +17.5% higher revenues.
Excluding the Tech sector’s substantial contribution, total S&P 500 earnings for the year would be up +14.7% (vs. +27.0% otherwise).
As we saw with Q2 expectations, contributions from Alphabet, Micron, and Nvidia are also significant here on an annual basis, as the chart below shows.

Image Source: Zacks Investment Research
The Revisions Trend – 2026 Q3
We showed in an earlier chart that S&P 500 earnings are expected to increase by +21.9% in 2026 Q3 on +10.7% higher revenues.
The revisions trend has remained positive, sustaining the favorable trend in place for almost a year now. The chart below shows how 2026 Q3 earnings growth expectations have evolved lately.
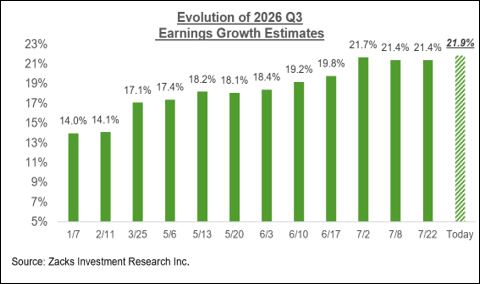
Image Source: Zacks Investment Research
As noted earlier, these favorable revision patterns are not a new development; they extend a tailwind that has been building for nearly a year. Historically, these upward adjustments were tightly concentrated in Technology and, more recently, Energy following Middle East supply disruptions. However, for Q3 2026, the constructive estimate revisions have broadened significantly, rising across 8 of the 16 Zacks sectors—including Transportation, Finance, Aerospace, Industrials, Utilities, and Construction, as well as Tech and Energy.
For a detailed view of the evolving earnings picture, please check out our weekly Earnings Trends report here >>>> Q2 Earnings Scorecard: Record Margins, Strong Beats and Upward Revisions
7 Best Stocks for the Next 30 Days
Just released: Experts distill 7 elite stocks from the current list of 220 Zacks Rank #1 Strong Buys. They deem these tickers "Most Likely for Early Price Pops."
Since 1988, the full list has beaten the market more than 2X over with an average gain of +23.9% per year. So be sure to give these hand picked 7 your immediate attention.
See them now >>Want the latest recommendations from Zacks Investment Research? Today, you can download 7 Best Stocks for the Next 30 Days. Click to get this free report
Amazon.com, Inc. (AMZN): Free Stock Analysis Report
Target Corporation (TGT): Free Stock Analysis Report
Walmart Inc. (WMT): Free Stock Analysis Report
Micron Technology, Inc. (MU): Free Stock Analysis Report
The Home Depot, Inc. (HD): Free Stock Analysis Report
Alphabet Inc. (GOOGL): Free Stock Analysis ReportThis article originally published on Zacks Investment Research (zacks.com).
Zacks Investment Research
